Guides
Does video do well on X?
It depends on what you measure. Buffer's 2026 medians put text slightly ahead of video on X; PlayerSells put an account's videos ahead of its other posts.
Evenpost / Guides / Does video do well on X?
Topics: Video and photos · Reach and analytics
Video does not automatically do well on X. It depends on what you measure. In March 2026 Buffer found text had a slightly higher median engagement rate than video on X (3.56% against 2.96%). PlayerSells, comparing each account only with itself, found posts with a video earned 51.0% above that account's other posts.
Use video when there is something to see, and text when the sentence is the idea. The sources below were checked on the access dates given with each citation. Posting video is not a promise that an account will grow.
Does video do better than text on X?
No single study answers that for every account. Buffer's March 2026 medians put text slightly ahead of video on X (3.56% against 2.96% median engagement rate), while PlayerSells, comparing each account only with itself, found posts with a video earned 51.0% above that account's other posts. The two use different methods.
Buffer's article Best Content Format on Social Platforms in 2026: 45M+ Posts Analyzed (published 19 March 2026; checked 2026-11-10) reported these median engagement rates for X:
- Text: 3.56%
- Images: 3.40%
- Videos: 2.96%
- Posts with links: 2.25%
Those figures are medians in Buffer's own dataset, from its 2026 State of Social Media Engagement report, not a universal benchmark for every account, niche, or week. Buffer is measuring engagement rate, not reach and not watch time. The same article does not publish a reach comparison for video versus text on X, so that comparison is unknown here and is not invented.
PlayerSells' Do images get more engagement on X? (the page's stated measurement date was 11 November 2026 when read on 10 November 2026; the page prints the day it is viewed; checked 2026-11-10) uses a different test: each account is compared only with itself. In that write-up, posts carrying a video earned 51.0% above the engagement of the same accounts' other posts (95% interval +49.3% to +52.7%), measured across 40,129 X accounts and 680,612 of their posts in the 30 days to 11 November 2026 as printed. The effect held for 28,234 of those 40,129 accounts individually. Text-only posts, with no image or video, earned 50.2% below the engagement of the same accounts' other posts (95% interval -50.9% to -49.5%), across 39,196 accounts and 774,829 posts, and that effect held for 30,088 of those accounts.
PlayerSells is clear about what that is not. The findings are observational, not a controlled experiment, and "cannot separate the format from the content." The sample "run[s] from about 1,000 followers to the largest on X and lean[s] heavily toward the large end," and "the direction of this finding could look different on a sample of small accounts." Video is a subset of the broader media bucket on that page, so the media table and the video table are not additive. Source: PlayerSells, "Do images get more engagement on X?" (checked 2026-11-10).
Those two results, side by side:
| Source | What it measured | Text, or no video | Video | What not to infer |
|---|---|---|---|---|
| Buffer, published 19 March 2026 | Median engagement rate in Buffer's own dataset | Text 3.56% | 2.96% | Not a within-account test. Not a reach figure. Posts with links were 2.25%. |
| PlayerSells, stated measurement date 11 November 2026 when read | Each account compared only with its own other posts, 30 days to 11 November 2026 as printed | Text-only posts 50.2% below that account's other posts | Posts with a video 51.0% above that account's other posts | Observational, not causal. The sample leans toward large accounts. The two PlayerSells media tables are not additive. |
Both rows were checked 2026-11-10 on the source pages above.
An X product lead describing how much of X's impressions already come from posts that contain video. That is impression share, not an engagement rate, so it sits beside the table rather than replacing it:
I'm going to answer this claim that “X is turning into TikTok” one time only:
• Posts containing videos already make up close to half the impressions on X
…
Nikita Bier (@nikitabier), July 6, 2026 (PT). View on X. Checked 2026-11-09.
Does video do better than a photo on X?
No study on this page shows video beating a photo on engagement rate. Buffer's March 2026 medians put images at 3.40% and video at 2.96% on X; Ordinal's 2024 to 2026 sample put images near 0.79% and video near 0.54%. PlayerSells reports media against text and video against no video, not video against image.
Three sources, three methods, side by side:
| Format | Buffer: median engagement rate (published 19 March 2026) | Ordinal: median engagement rate and average impressions (posts January 2024 to May 2026; read 2026-11-10) | PlayerSells: effect against the same account's other posts (30 days to 11 November 2026, the date the page printed when read) |
|---|---|---|---|
| Text only | 3.56% | roughly 0.68%; roughly 35,975 impressions | 50.2% below |
| Photo | 3.40% | roughly 0.79%; roughly 18,334 impressions | not reported separately; any image or video 111.4% above |
| Video | 2.96% | roughly 0.54%; impressions not reported | 51.0% above |
| Link post | 2.25% | not reported | link preview cards do not count as media |
Read down the engagement-rate columns and no source puts video ahead of a photo. Buffer and Ordinal both have photos ahead of video, and Buffer has text ahead of both. PlayerSells shows that, inside the same account, posts that carry media beat that account's text-only posts, and video is part of that media group; it does not publish a separate photo-against-video figure.
The methods differ, so the columns are not interchangeable. Buffer's 45M+ post analysis reports medians from its own 2026 State of Social Media Engagement report. Ordinal's Twitter/X Engagement Data Study divides likes, replies, reposts and quotes by impressions, uses medians, says its sample skews toward B2B and startup accounts posting at higher volume, and puts its sample at 87,528 posts (stated in its FAQ); its page labels the 0.79% and 18,334 figures both "image posts" and "media posts", and calls video "the weakest performer in the set". PlayerSells is observational, leans toward large accounts, and says it "cannot separate the format from the content."
On reach rather than engagement rate, Ordinal's text-only posts averaged about twice the impressions of its image posts (35,975 against 18,334), and tmaker's founders saw video at about 1.1 times text on views, an edge that shrank week by week. Neither is a controlled test.
Did Twitter say video gets 10x more engagement?
Yes, in 2019, and that line is not a current statistic. Search Engine Journal reported on 26 August 2019 that Twitter said tweets with video can attract ten times the engagement of tweets without video. The live comparison on this page is Buffer's March 2026 medians and PlayerSells' within-account 2026 measurement. Do not reuse 10x as current.
Source: Search Engine Journal (checked 2026-11-09). Social Media Today reported related Twitter video-marketing stats on 12 March 2019 (the article).
When does video win, and when does text win?
Video is the better fit when the idea is something a stranger needs to see, such as a result, a demo, or a before and after. Text is the better fit when the sentence is already the post, such as a claim, a question, or a short report that does not need a moving picture.
Read the two studies as bounds, not as a verdict. In Buffer's dataset, a typical text post had a slightly higher median engagement rate than a typical video post. That is a reason not to shoot a clip for its own sake, and a reason to keep posting sentences when a sentence is the idea. In PlayerSells' same-account comparison, a typical measured account earned more engagement on the posts that carried a video than on its other posts, and text-only posts sat well below that account's own baseline. That is a reason not to default to text when you have something worth watching, especially if your account already posts a lot of media. PlayerSells also notes that 58.1% of the original posts in its sample already carried an image or video, so media is the baseline in that set rather than a rare bonus, and that "an image that adds nothing still occupies the slot a reader would otherwise scroll past."
A practical split, without turning either study into a promise:
- Use video when you can show a result, a demo, a before and after, or a failure a person has to see to understand.
- Use text when the point is a claim, a question, or a short report that does not need a moving picture.
- Do not attach a clip, or a stock image, only to avoid being "text-only." Empty media still takes up the slot.
- Be careful with link-only posts. In Buffer's table, published 19 March 2026, posts with links had the lowest median engagement rate on X in that dataset. That is an observational rate in Buffer's sample, not evidence that X deboosts posts because they contain a link. On 8 April 2026, Nikita Bier wrote that links were never deboosted, and that X had stopped covering Like and Reply with the in-app browser so those posts have the same shot at likes (checked 2026-11-09); the full answer is in Does X penalize links?. On the PlayerSells page, a link preview card is not counted as media, so a post whose only visual is an unfurled outbound link sits in the text-only bucket.
The useful question is whether the idea needs to be seen, not whether video always wins.
A founder launch that attached a native demo people could watch:
✨ My new project is now live:
https://t.co/HzGGlHq1Jf
🏡 It uses A.I. to let you generate @ArchDaily-style modern architecture houses on-the-fly
If you generate any nice ones, reply them here pls 😊 https://t.co/zjIvMzTX4M
@levelsio (@levelsio), September 5, 2022. View on X. Checked 2026-11-09.
When Pieter Levels launched ThisHouseDoesNotExist, the announcement was the demo: a native video, a one-line explanation, a link, and an invitation to reply with generations. See Pieter Levels's case study for the sourced numbers, including 111,139 video views (checked 2026-11-09).
Why can one study have text ahead and another have video ahead?
They are measuring different things, on different sets of accounts, so both can be true in their own frame. Buffer reports a median engagement rate across posts in its dataset, while PlayerSells reports how a typical measured account's video posts compare with that same account's other posts. Neither is a randomized test of switching one post from text to video.
A text post and a video post from different accounts are in the same Buffer table. A large account that already posts a lot of media can move PlayerSells' number without changing Buffer's ranking of formats. PlayerSells itself says the direction could look different on small accounts.
A founder-only view study by tmaker (Founders' videos on X, 96 founders, 15 September to 13 October 2026) reported videos at 1.1x the views of the same founders' text posts, with video's edge shrinking week by week (checked 2026-11-10). It measures views, not engagement rate, so it is not used in the table above.
X's published For You ranking code is a third source, and it is about predicted attention and conversation, not about a format trophy. The x-algorithm repository (checked 2026-11-09) lists video open, video quality view, and video continuation seconds among the actions the ranking predicts, alongside dwell, replies, quotes, and shares. In the 8 October 2026 update, the README says ranking "now does a better job of estimating how long you'll spend on each post." In the 13 October 2026 update, it says retrieval is "now also trained to surface posts that people read all the way through." Source: the repository README (checked 2026-11-09).
The published default config values for the video-specific heads were 0.0 in `home-mixer/params/param.rs` as of the file's "last sync 2026-11-09T16:00:34Z" comment (VideoOpenWeight, VqvWeight, QuotedVqvWeight, and PostVideoWeight). Dwell and the conversation actions were published with non-zero default config values in the same file. Those numbers are default config values in the public repo. They are not proof of what runs in production. The README also says X runs experiments on a share of traffic, and that tunable values are read from a configuration system. The commit checked for this guide is 660cd74 (checked 2026-11-09).
X is explicit about how to read the weights: they multiply a predicted probability, or a predicted stretch of time, for one viewer. They do not multiply raw likes, replies, or views, and a weight ratio is not a claim such as "one reply cancels N likes." Source: the comments in `param.rs` and the README (checked 2026-11-09). The file also has a 10,000 millisecond gate (MinVideoDurationMs) used when deciding whether a video quality view prediction applies. Because that head's published default config value was 0.0, this guide does not treat "make it longer than ten seconds" as a ranking rule worth chasing.
The useful "why" is quieter than a format slogan. A clip can hold the time someone spends on a post, and conversation (a reply, a quote, a share) is part of how a post is scored. A video is worth making when a stranger would actually watch it and might answer. It is not worth making because the file type is supposed to win.
How do you post a video so it is not hurt?
Post a video on X by attaching the file in the post itself, not as a link to a clip hosted elsewhere, and by uploading your own original footage rather than a repost from another network. X's codec, duration, size, and processing rules are covered in the X video specs guide; what Evenpost accepts is on the video docs.
Nikita Bier has also written that a video which is a repost, or which comes from a third-party network, can lose up to 90 percent of impressions:
@DailyLoud If it’s a repost or from a third party network, there will be up to a 90% deduction on impressions.
I recommend recording original videos with your own voice over. We want net new content on the app.
Nikita Bier (@nikitabier), April 11, 2026. View on X. Checked 2026-11-09.
Vertical, horizontal, and square are all in X's recommended list; which one to choose is in Vertical or horizontal video on X?.
Evenpost is an app for X (Twitter) for solo founders. Your agent drafts from your work, you approve every post in the Evenpost app, and Evenpost posts with even spacing. Updates: @evenpost.
A short MP4 attached to a draft, waiting for approval, in the Evenpost app on a test account, 10 November 2026:
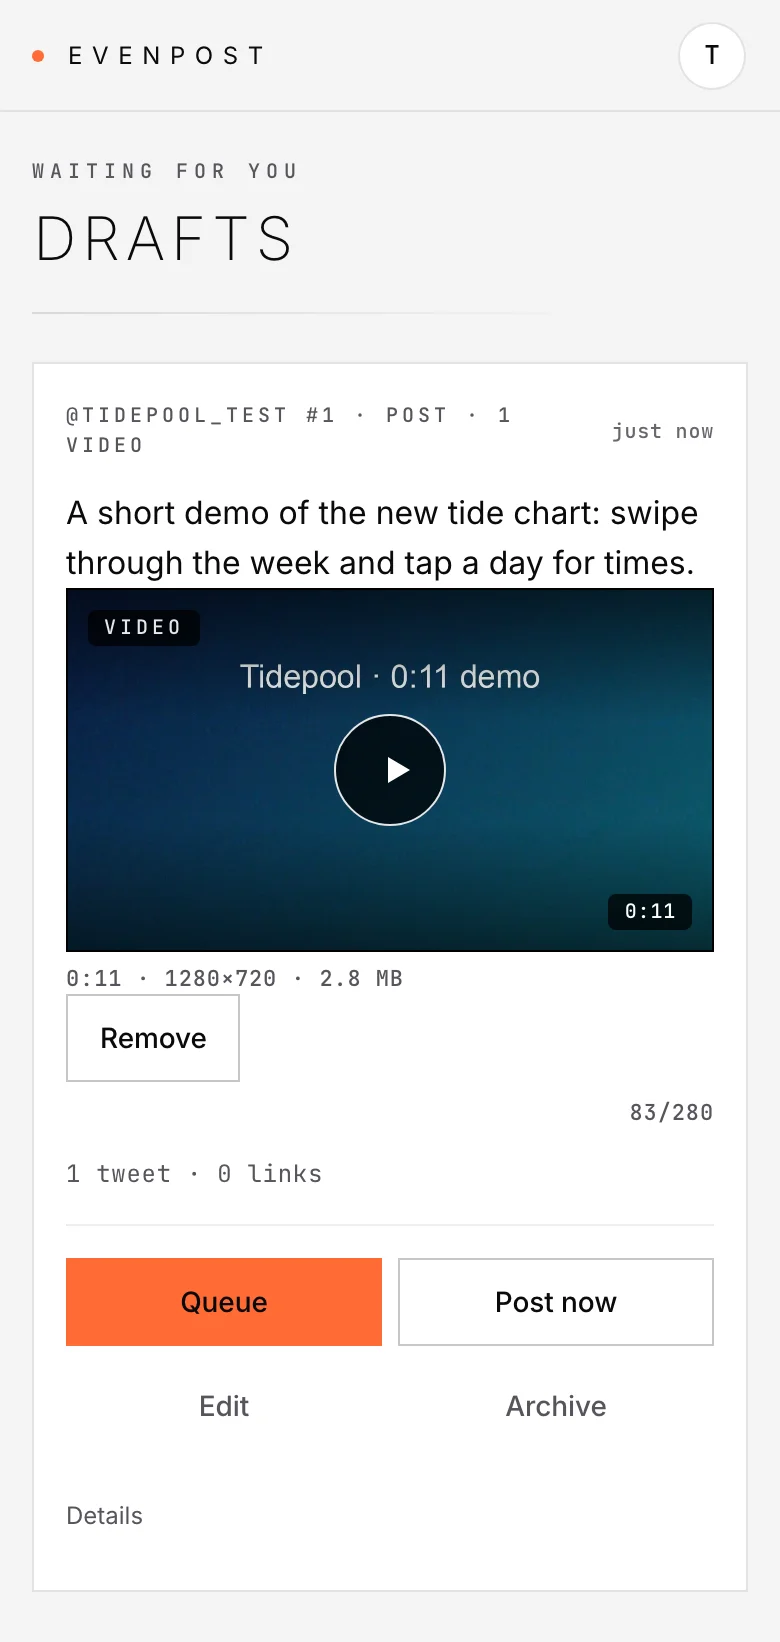
If you and your agent attach a video to a draft, you approve the exact post in the app today. During the beta, this is only on accounts where video is turned on. What video Evenpost accepts is the live page for the product's rules, including how long a copy is kept. This guide does not repeat those rules, and it does not treat them as X's limits. For the broader approval loop, see AI agent posts to X with human approval. Setup starts at the install page.
FAQ
Does video get more reach than text on X?
Unknown from those sources. Buffer's March 2026 article reports median engagement rates for text, images, video, and links on X, not a reach comparison. PlayerSells reports within-account engagement effects, not reach. The sources do not give a reach percentage. If you need reach, measure it on your own posts.
Do photos or videos get more engagement on X?
In the two cross-account datasets on this page, photos edged video on engagement rate: Buffer had images at 3.40% and video at 2.96%, and Ordinal had images ahead of video as well. PlayerSells does not separate the two. Post the format that shows the idea, not the one a table favors.
Should I post video instead of text?
No. Use the format that fits the idea. In Buffer's dataset, text still led median engagement rate on X. In PlayerSells' same-account comparison, video posts earned more than the same account's other posts, with caveats on that page. Post a video when there is something to see. Post a sentence when the sentence is the idea.
Does X boost every video in the For You feed?
Not something this page can claim. The published default config values for the video-specific ranking heads were 0.0 in the public repo as of the 9 November 2026, checked 2026-11-09. Those are default config values, not proof of what runs in production. Dwell and conversation actions had non-zero published defaults in the same file.
Where are X's video length and format limits?
X's video length, size, and format limits are on X's media upload best practices page, and the detail is explained in the X video specs guide. Evenpost's own accepted formats are a separate list, on the video docs, and the two should not be mixed.
Are X's video limits the same as Evenpost's?
No, and they should not be mixed. X's duration, size, and format rules are on X's media upload best practices. What the product accepts, when video is turned on for the account, is on the video docs. Cite each to its own page.
Updated 11 Nov 2026 · By Evenpost